

What are the benefits of using tachograph data analysis software?
European legislation regarding tachographs, data registration and road safety, can be difficult to understand, let alone manage. If you're a business owner dealing with international transportation and logistics on a daily basis – we don't envy you! And if you're new to this, here's why.
As of now, all commercial vehicles first registered on or after 1 May 2006 have to be equipped with digital tachographs. Driver data has to be registered on a digital card and all travel data from the card must be downloaded at least every 28 days.
From there you have one of two options – either you know all the ever-changing rules by heart and can follow up on each driver's hours, or you get someone to do the job for you.
In all likelihood, some of the more experienced professionals do in fact know most of the rules by now, but the human input always begs for human error. If the math goes off, you may be facing a large fine. We're talking anywhere from 3000 up to 60 000 euros, which will certainly put a dent in any wallet!
And while the second option won't completely prevent you from getting fined, as it's ultimately the result of a driver's actions, it will give you a straightforward picture of the situation and less of a headache when handling it. Here's where digital tachograph data analysis tools such as Tachogram come in.
A tool dedicated to tachograph data
If you enjoy going to a restaurant now and again, you'll know that a very big selection isn't always the best indicator of quality meals. A shorter, more dedicated menu, on the other hand, will tell you that the meals are well thought-out and very refined. The same can be said here.
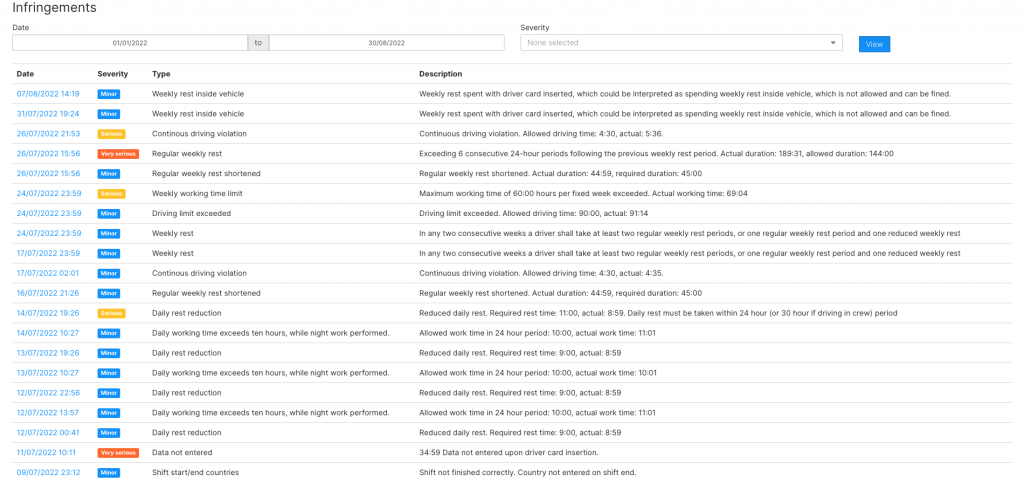
Tachogram is a tool that's sole purpose is to read, analyse and showcase all the data registered by a tachograph in a clear and easy way. In short, turning this –
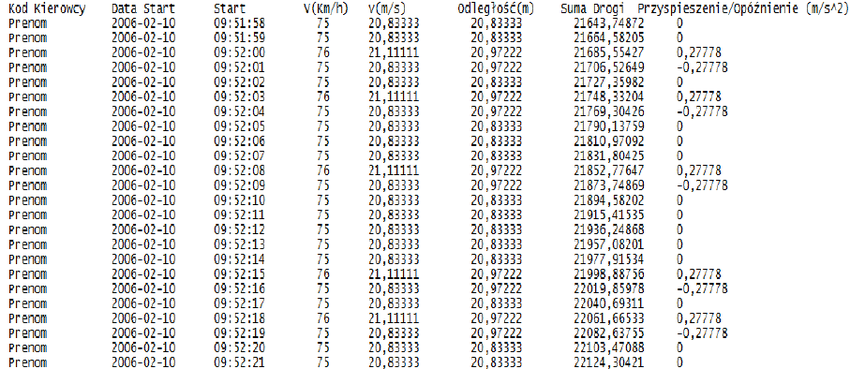
Source: Data registered by a digital tachograph (Source: Drabpol) R ys. 2. Dane zarejestrowane za pomocą tachografu cyfrowego (Źródło: Drabpol)
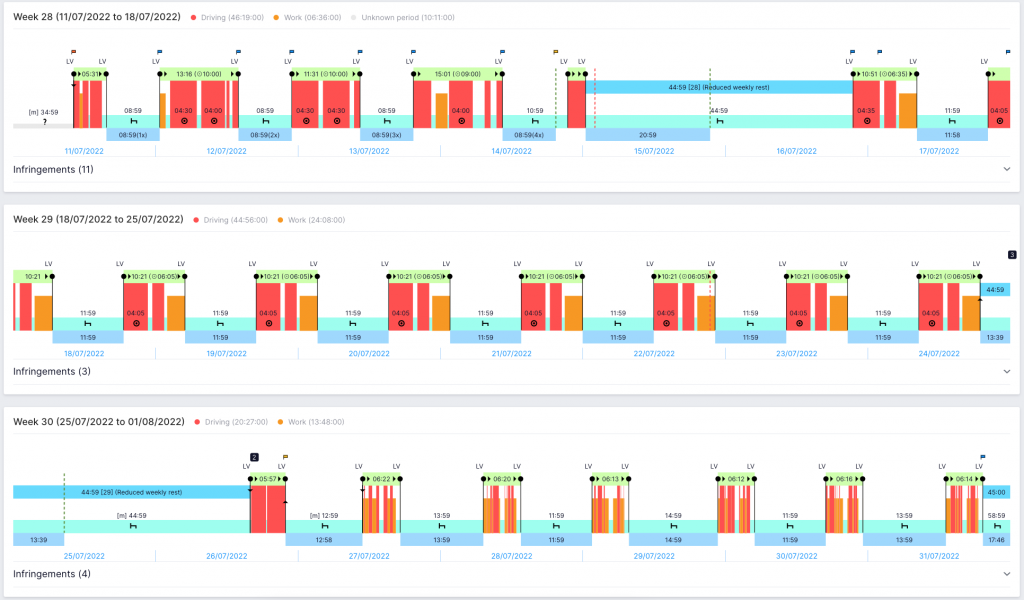
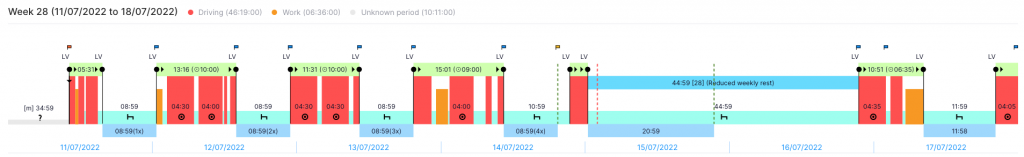
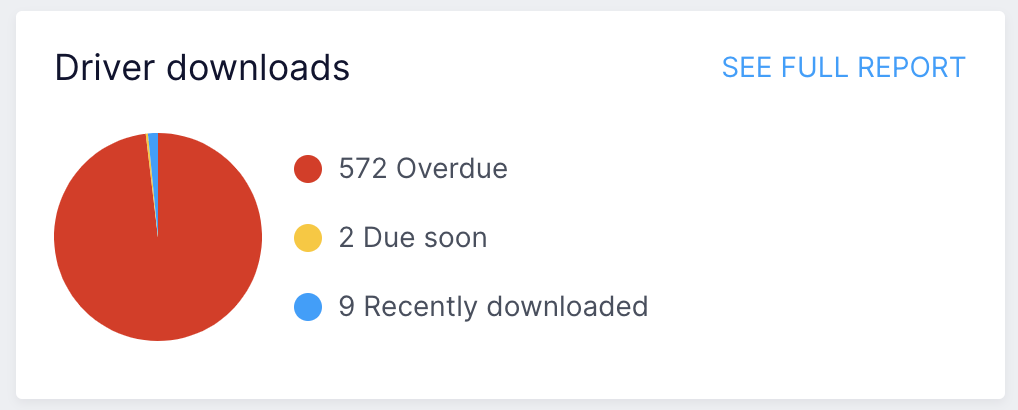
into this –
To find out more about what this is, keep on reading!
Must-have features for tachograph data analysis
If you're looking for a fresh new option to help you with your team's tachograph data analysis, it can get confusing, as most tools may seem alike. We're here to make it easy for you by explaining what features and why you should be looking out for when choosing a tachograph analysis software.
1. Clear and concise tachograph data interpretation
One of the most important factors to any tool is user experience. If it's too difficult to manoeuvre and understand, it doesn't really matter how good it is, as you won't ever want to use it.
Tachogram offers easy-to-understand graphs and dashboards, presenting the coarse blocks of information in a comprehensive way. For example, activity graphs. They can be viewed by days or weeks for each driver to understand their workload. They're made bright and colourful, but also in clear blocks so that those with CVD (colour vision deficiency) can still easily use them!
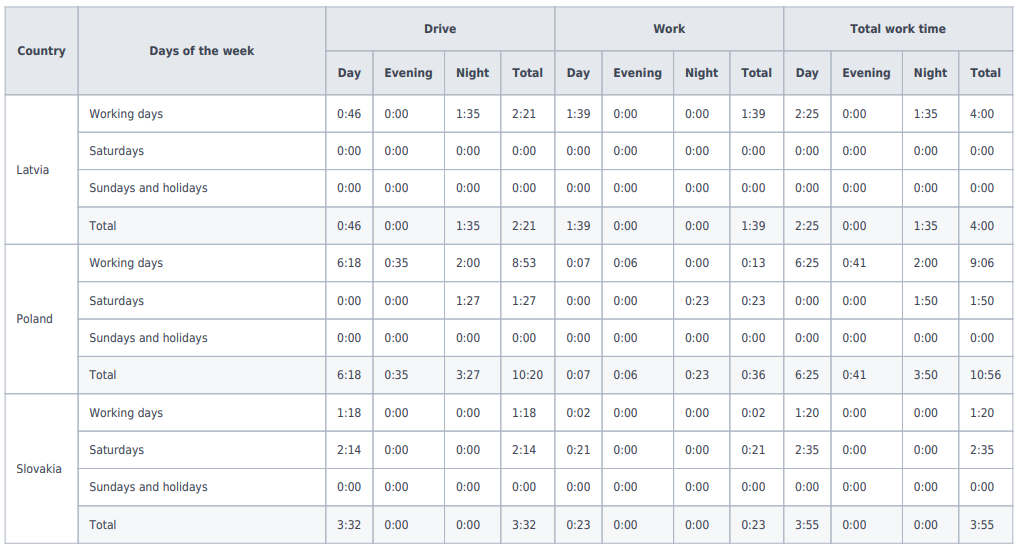
If you're in charge of a larger group of people, you'll also be happy to hear that all of the information you may need in a structured, exportable form is also available in reports. Anything from driving time to rest time, distances done and countries travelled are available to you at any time.
2. Accurate account of driving and rest times
Tachogram is built on a set of EU laws and regulations, such as the regulation on driving and rest times, the Mobility package rules and others governing tachograph-related matters. Not only that, the team is actively following any and all changes to these laws, making sure that the information is always accurately interpreted.
This means that not only the information from the driver card is read, translated and reflected in a colourful graph, but the platform is able to show, if, when and what rules a driver has broken.
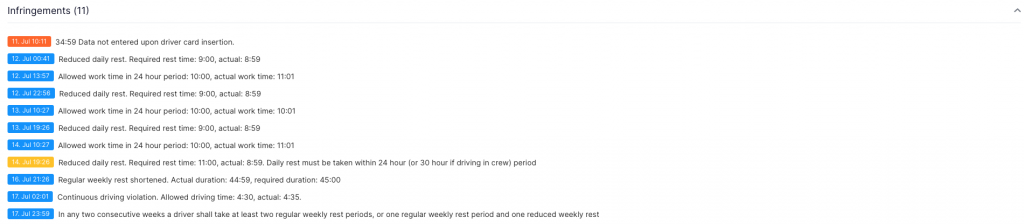
This not only allows you to see potential liability, but also avoid recurring infringements by way of explaining to the driver where they can improve.
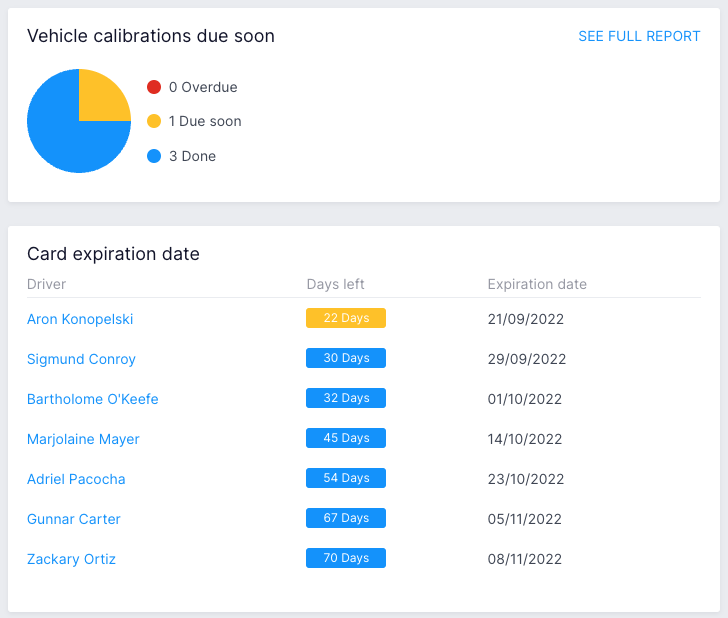
3. Driver card download once every 28 days
Notifications on upcoming tachograph file downloads, card expiration and calibration dates can be a lifesaver in between the hustle and bustle of everyday business. Remember that each driver has to download his/her driver card data every 28 days, while each vehicle's data has to be downloaded every 90 days.
Now let's say you have around 50 trucks and 70 drivers, everyone has places to be and a schedule to keep. People might want to put off their administrative tasks until they get home. Understandably, once there, work is the last thing on their minds. While vehicles can be set to travel large distances, and unless you have the option of remote tachograph download, you're gonna have to make sure they're all back home before their download deadline comes around.
It's close to impossible for every single person to be diligent in their tasks 24/7. And a quick reminder, can mean the difference between turning a profit or taking losses.
And because Tachogram offers Android and iOS mobile apps, your team can immediately react to the reminder and download their driver card data from anywhere!
The experience of freight carrier UNA-L shows that thanks to Tachogram, over the last four years they've been able to work without any data download violations.
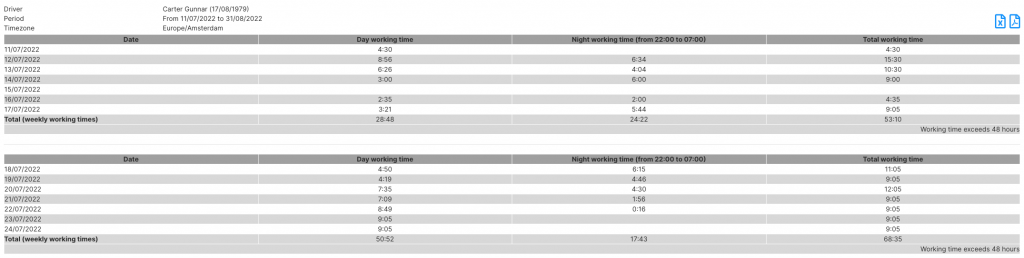
4. Tachograph data reports
Any data analyst will tell you that, when asked the right questions and knowing what you hope to gain from it, data can be a very valuable resource. With this in mind, Tachogram has built multiple report forms that will help any team get precise numbers if and when they're needed. And based on market needs, new ones are continuously being made.
Make your schedule planning, bookkeeping, and salary calculations quick and easy with reports, such as:
Work time summary per driver
Work time summary per country
Driver/Vehicle download status
Travel allowance per driver
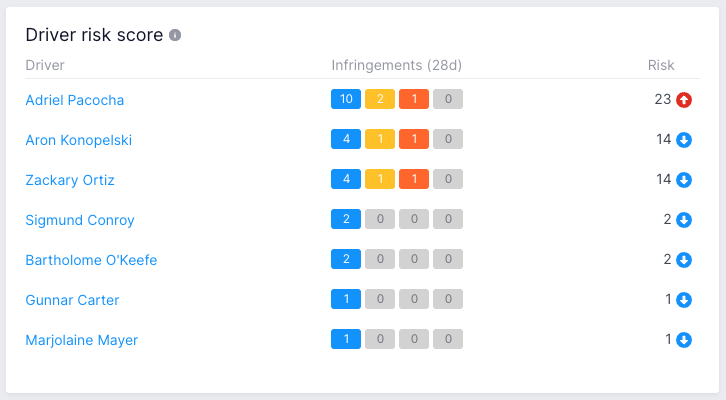
Driver risk rating
And more!
Each of these reports can be generated for specific time periods, persons or groups, including or excluding additional criteria for a more detailed overview.
5. API's for seamless business processes
Lastly, integration possibilities. If you're running a business, there's a good chance you're dealing with several different platforms every day. So why would you want to add another one? Tachogram offers a great opportunity to integrate its platform with other products to streamline the information flow and ease your team's workload. A perfect example of this is accounting.
Tachogram provides consolidated data, such as overall working time, driving time and rest time, to such details as how many hours were done during weekdays, holidays, daytime, night time, in which country and so on. All of this can be seamlessly streamlined into your accounting system, giving you a precise data set for calculating your team's compensations.
https://www.youtube.com/watch?v=W9U_wRQ0GPw
Ultimately, it's best to pick a tool that will not only help understand and keep track of your team's tachograph data, but that'll also help maximise the information available to you.
Curious to see Tachogram up close? Go ahead and start your 14-day-free trial!


